Sometimes there is a need for simple and quick analysis or the troubleshooting of a SIP server and its call functions. Of course, we should use the well-known tcpdump, mentioned in the article Using tcpdump for SIP diagnostics. However, for some occasional Linux users this may be too difficult and unclear. Actually there exist some simpler utilities,, that could work fine, as ngrep, and for me newer sipgrep and sngrep (love at first sight).
All utils are directly available and can be installed online from Debian repo using apt-get install ngrep sipgrep sngrep.
Ngrep
web: https://github.com/jpr5/ngrep
For years I have been using ngrep (described in Ngrep – a tool for VoIP analysis). Preferred to save formatted messages to a file:
ngrep -d any -p -q -W byline port 5060 > test.txt
or to watch on the fly (could be to fast for analysis)
ngrep -d any -p -q -W byline port 5060
Sipgrep
web: https://github.com/sipcapture/sipgrep
Sipgrep is a grep tool for SIP diagnostic, where opposed to generic ngrep, it allows us to focus on certain SIP fields (To, From, Contact …). Tool highlights SIP information as the transaction and dialog information.
For the simplest use type
root@voip ~ # sipgrep
 interface: eth0 (158.193.152.0/255.255.255.128)
 filter: (ip or ip6) and ( portrange 5060-5061) or (udp and ip[6:2] & 0x3fff != 0)
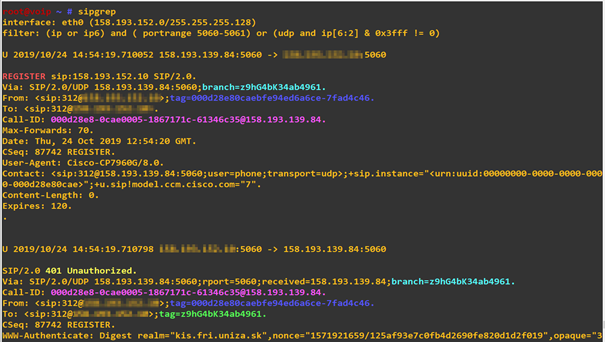
But sipgrep also allows to simply focus on specific SIP AORs. For example to show all messages from SIP URI (AOR) 1765
sipgrep -d any -t 1763 -G
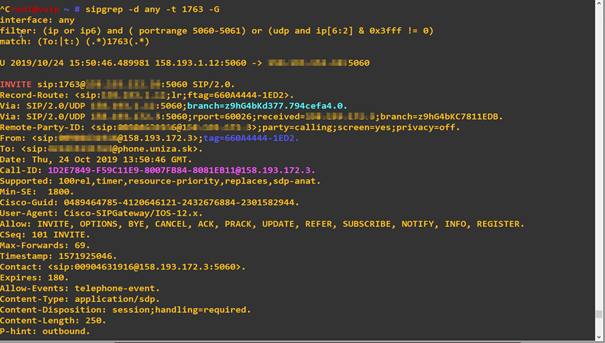
More at man sipgrep or project home page.
Sngrep
web: https://github.com/irontec/sngrep
A big surprise for me, the great tool sngrep, Provides a nice overview of what is happening on a SIP Server arranged on a dialog view. We may move using arrows keys and using enter and Esc keys simply look into each SIP message of the dialog.
Features:
- Capture SIP packets from devices or read from PCAP file
- Supports UDP, TCP and TLS (partially) transports
- Allows filtering using BPF (Berkeley Packet Filter)
- Save captured packets to PCAP file
Simplest use? Just type
sngrep
and watch 😉 For the movement use arrow keys, Enter (go in), Esc (or q to go back) and F8 or c for message highlight.
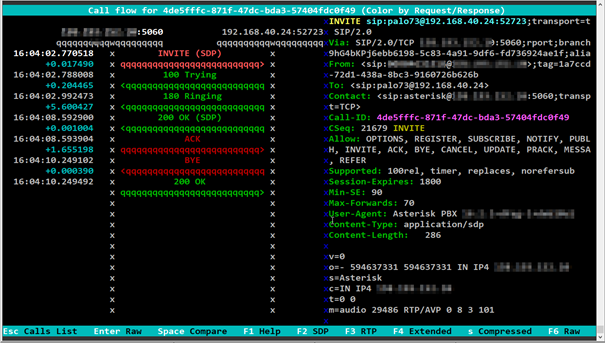
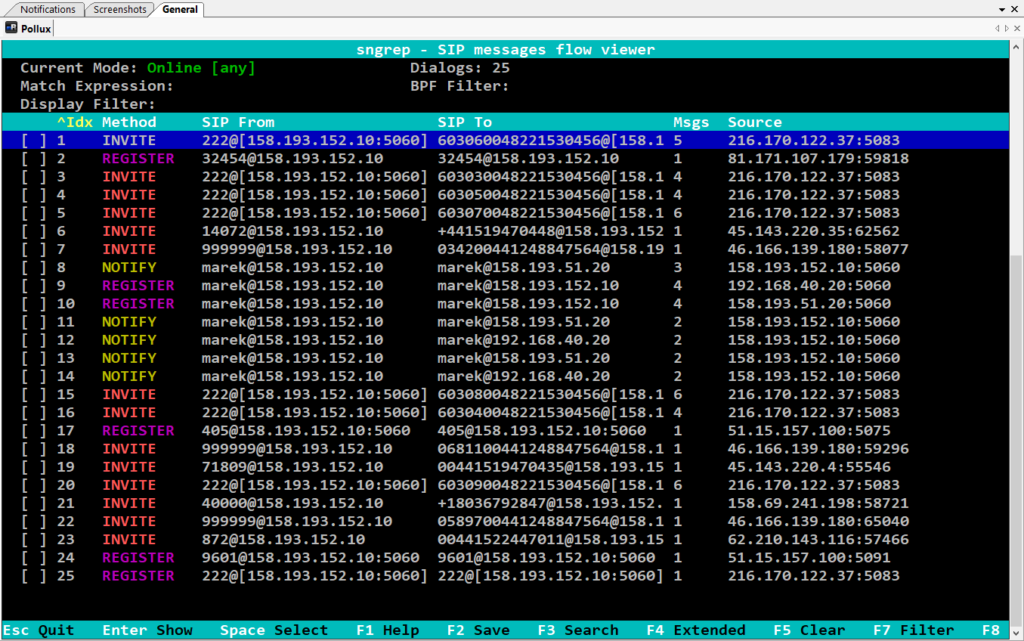
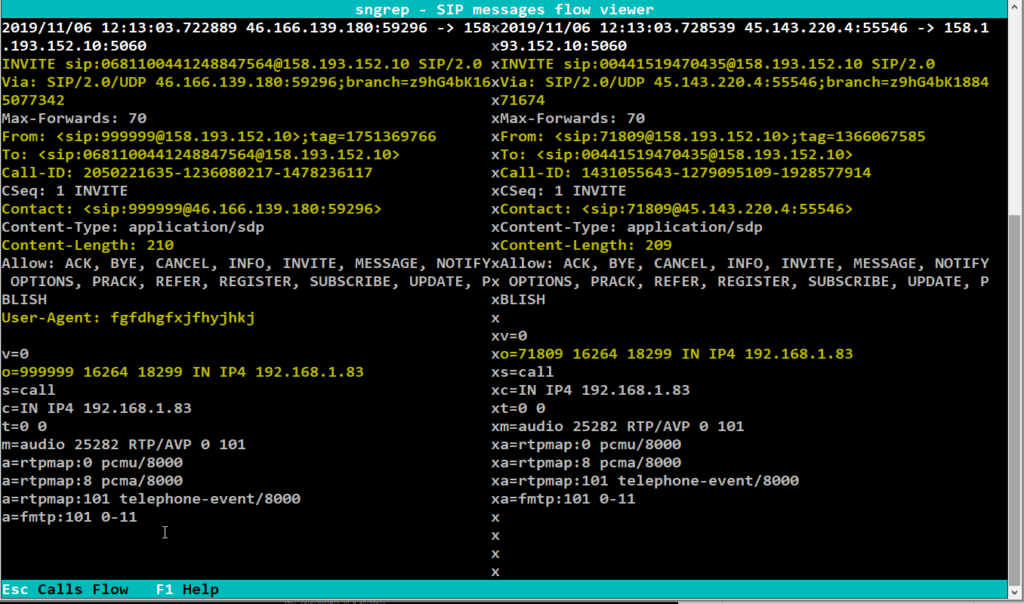
of course, it allows more. Sngrep shows information using several windows:
- Call List Window: Shows and allows to select calls (dialogs) to be displayed in deeper detail (use arrow keys to select one call from the list or in combination with
Spacebarkey select more calls and hit the Enter then).

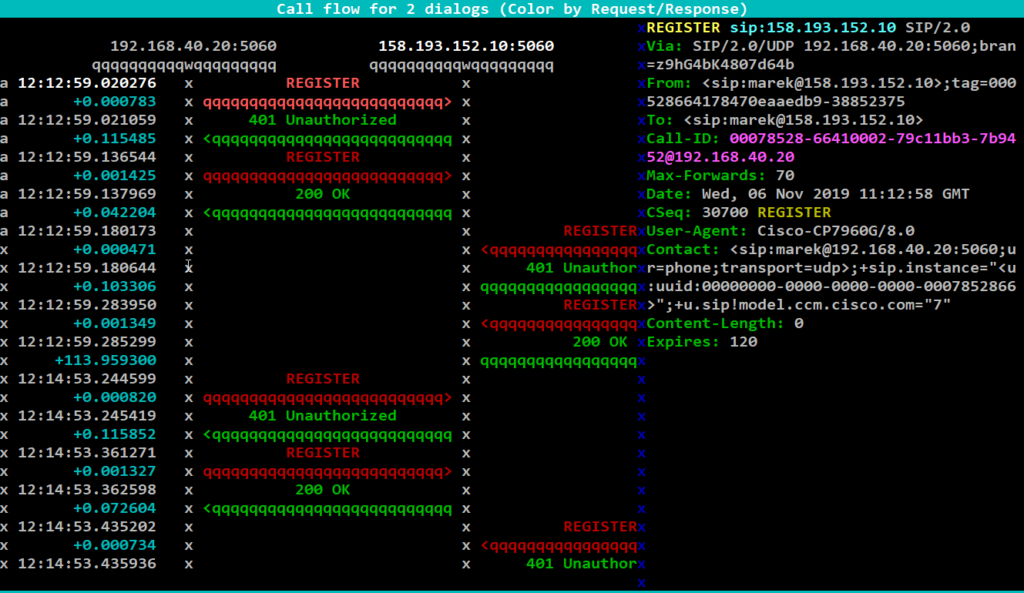
- Call Flow Window: displays selected call from the Call list window.
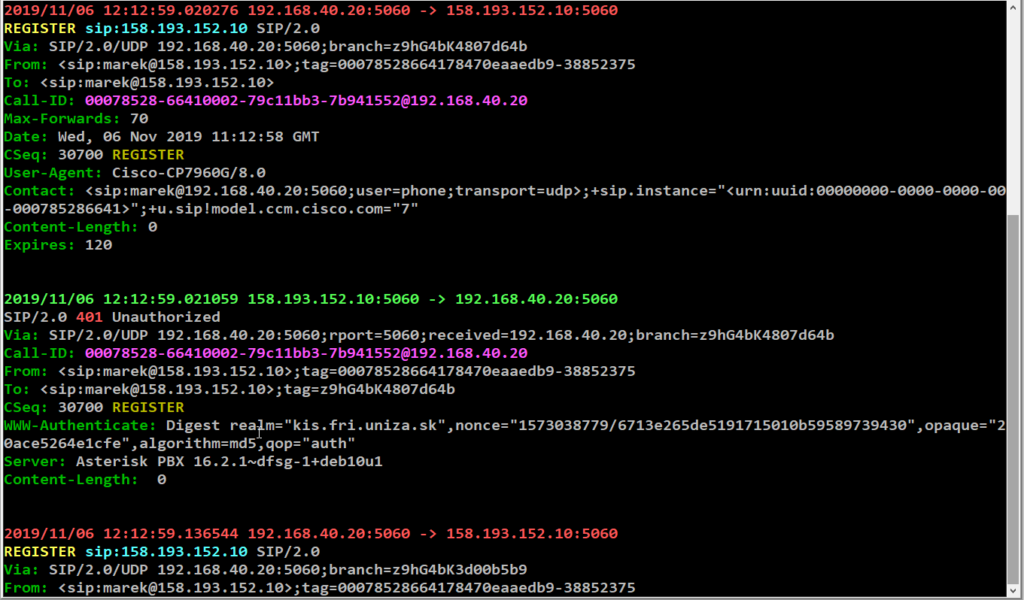
- Call Raw Window: Display selected dialog messages in plain text (useful for copy messages to clipboard). Go in from Call flow window using the
F6key
- Message Diff Window: the window will compare and shows differences of two messages. Reach the window by selecting two messages using
Spacebarinside of the Call Flow window
sngrep – command line arguments
sngrep [-hVcivNqrD] [-IO pcap_dump] [-d dev] [-l limit] [-k keyfile] [-LH capture_url] [<match expression>] [<bpf filter>]where:
- null
- -h –help: This usage
- -V –version: Version information
- -d –device: Use this capture device instead of default
- -I –input: Read captured data from pcap file
- -O –output: Write captured data to pcap file
- -c –calls: Only display dialogs starting with INVITE
- -r –rtp: Capture RTP packets payload
- -l –limit: Set capture limit to N dialogs
- -i –icase: Make case insensitive
- -v –invert: Invert
- -N –no-interface: Don’t display sngrep interface, just capture
- -q –quiet: Don’t print captured dialogs in no interface mode
- -D –dump-config: Print active configuration settings and exit
- -f –config: Read configuration from file
- -R –rotate: Rotate calls when capture limit have been reached.
- -H –eep-send: Homer sipcapture url (udp:X.X.X.X:XXXX)
- -L –eep-listen: Listen for encapsulated packets (udp:X.X.X.X:XXXX)
- -k –keyfile: RSA private keyfile to decrypt captured packets


